How a Software Team Plans a Release with an AI Gantt Chart
Ganty Team
Gantt charts get a bad rap as heavy and tedious to update — but that changes when the updates can be handled by AI. Here we follow a concrete flow: a five-person software team planning a ten-week release, to show how an AI Gantt chart earns its place in a dev team's workflow. (The team here is illustrative.)
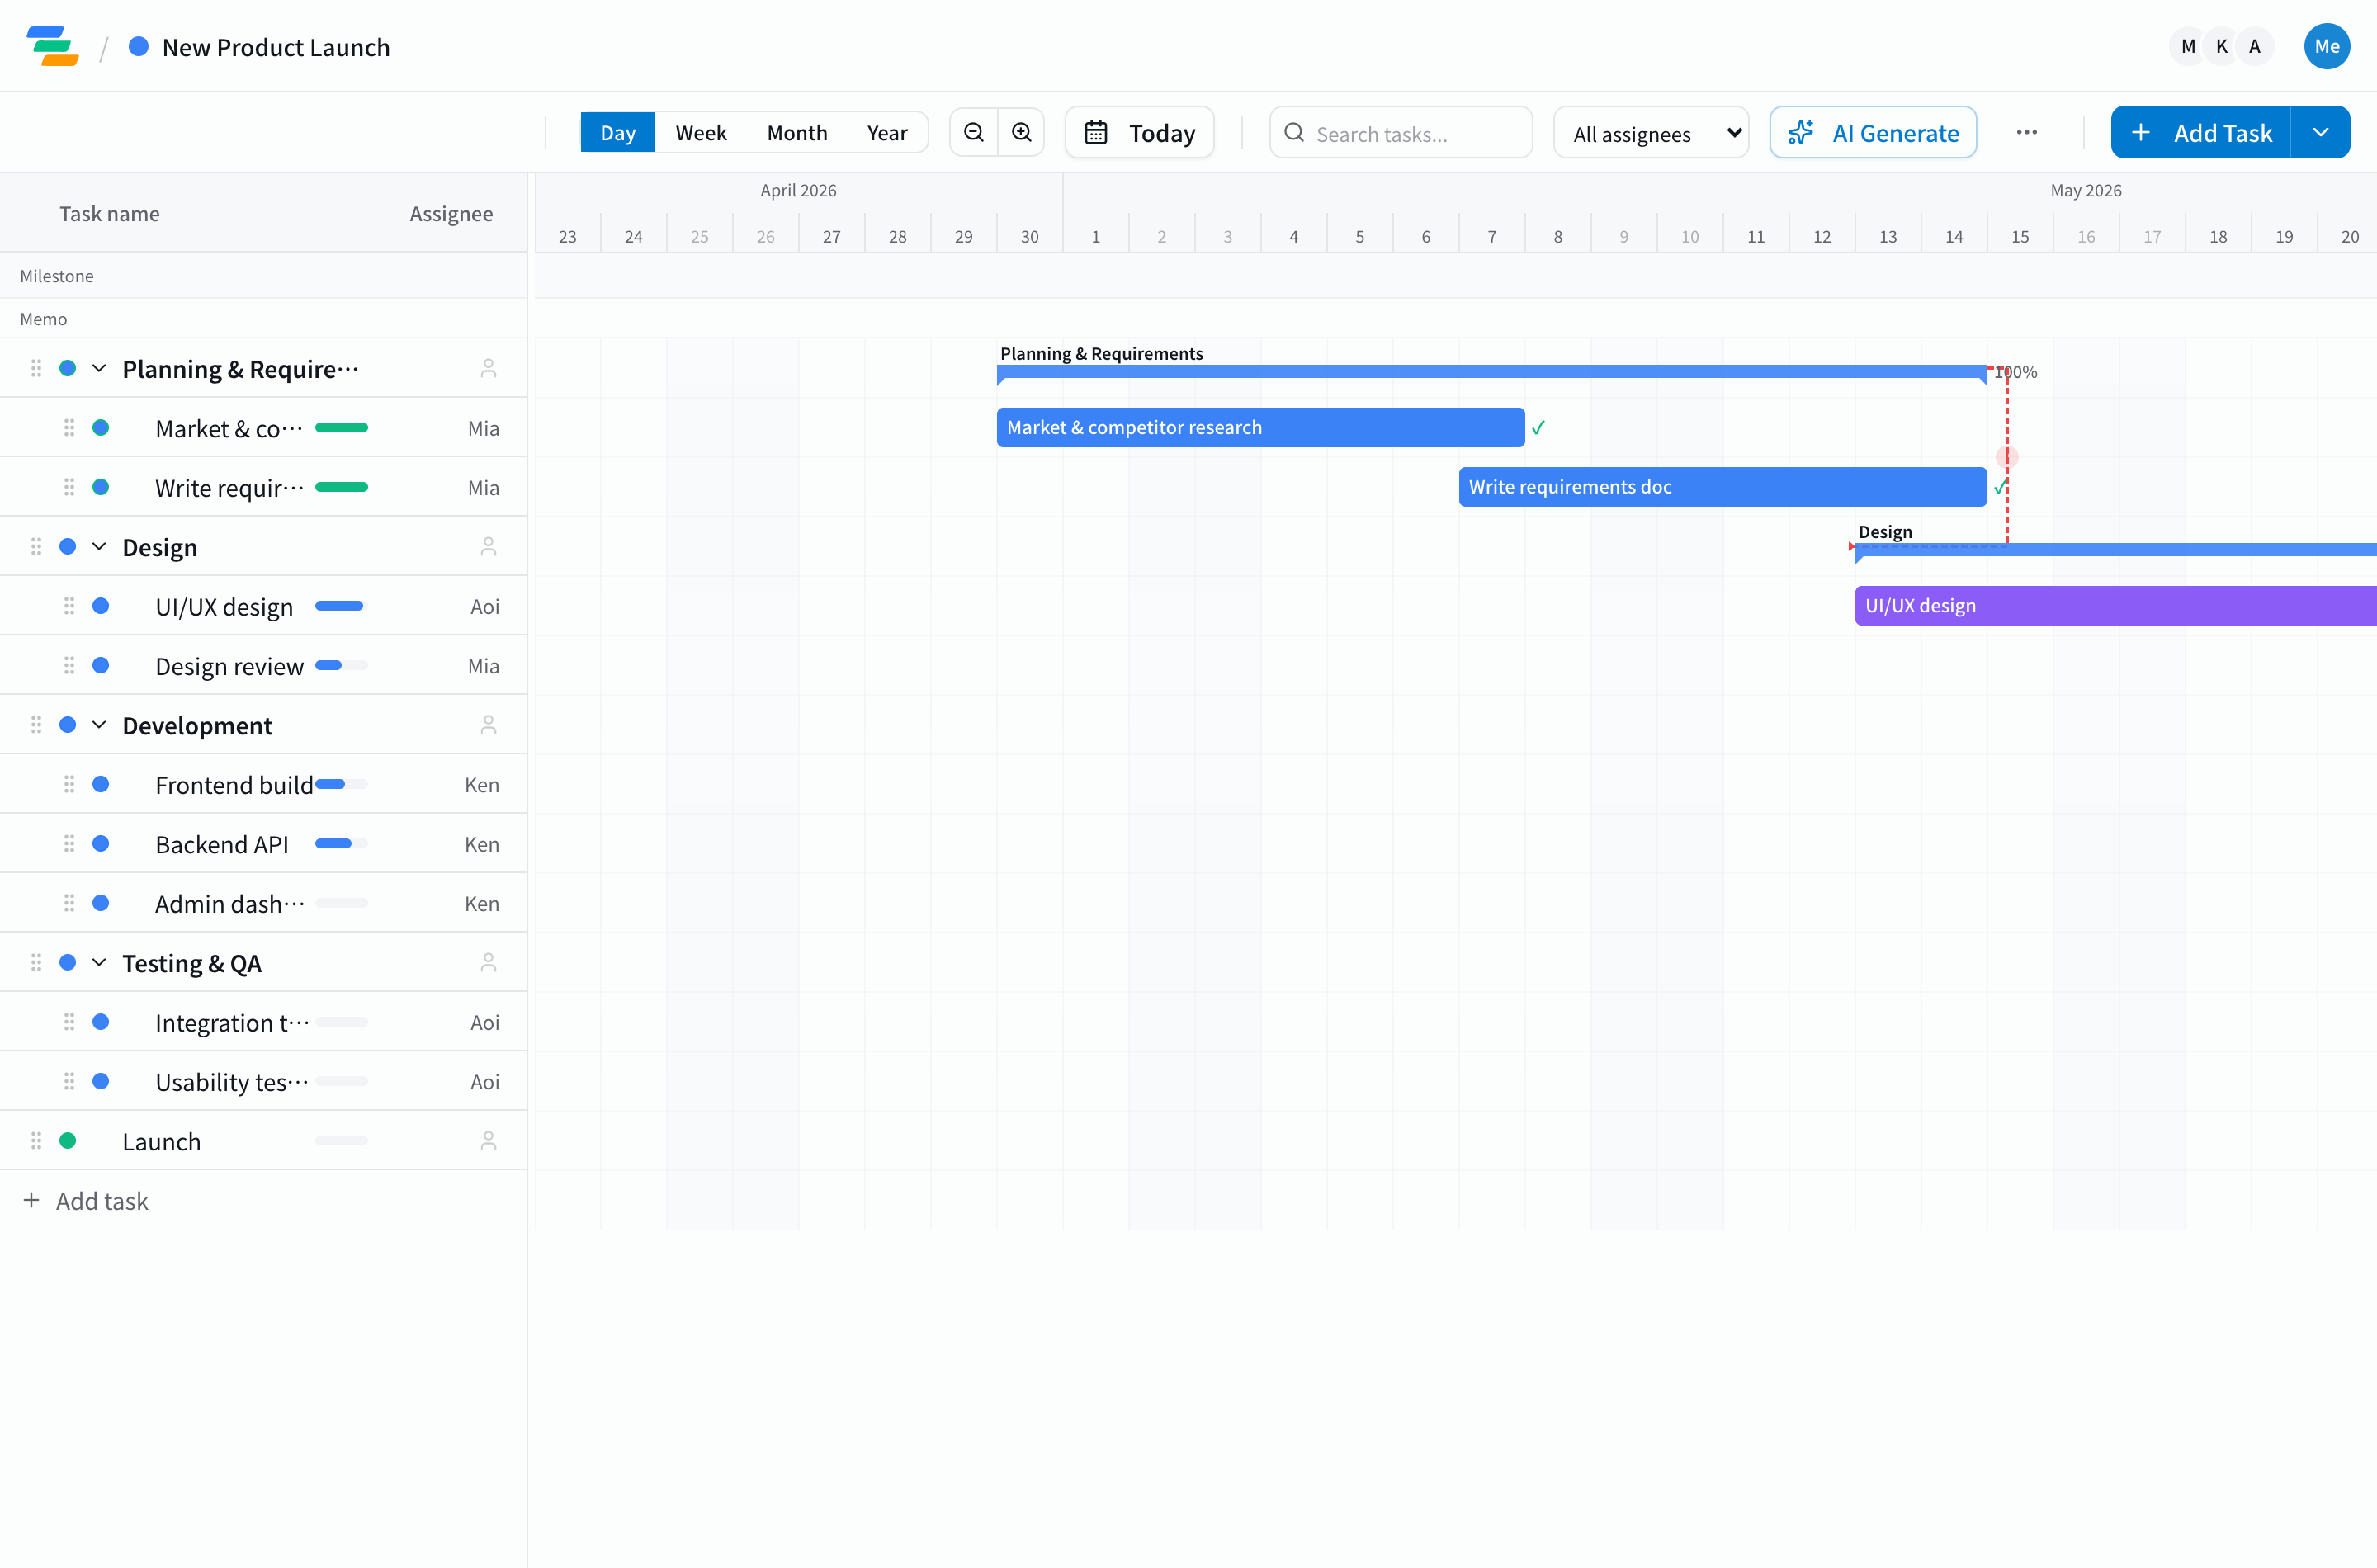
1. Draft the plan from one line
Don't start from a blank canvas — hand it to AI. Type "ship a new dashboard feature in ten weeks, with planning, design, frontend/backend dev, QA, and release," and you get a Gantt chart with tasks, durations, and dependencies in seconds. It doesn't need to be perfect. Having a starting draft is vastly faster than a blank page. More on generation in using AI task auto-generation.
2. Drag it toward reality
The result is a normal Gantt chart, so assign owners, adjust durations, and drop milestones (code freeze, launch day). Model your team's reality — frontend and backend in parallel, QA depending on dev — in a few minutes.
3. Do daily updates from your editor or chat
This is the biggest departure from the old way. You don't open a separate tool to update progress — you talk to Claude or Cursor over MCP while you work.
- "Mark the backend API done." → progress updates
- "What's due this week?" → know it before standup
- "Add a bug-fix task to the dev phase." → applied on the spot
The plan stays current without breaking your development context. For a concrete Claude Code workflow, see project management in Claude Code.
4. When something slips, cascade the reschedule
Real projects always slip. Say "design review slipped three days — push everything after it," and Ganty reschedules downstream tasks along the dependency graph in one shot. Dev, QA, and the release date all shift together, so you never fix them one by one. And because this math runs deterministically on the server rather than being guessed by the AI, letting AI drive doesn't break your dates (why: why AI-generated schedules drift).
5. Share read-only with stakeholders
Hand managers and other teams a read-only Gantt via a share link. Everyone sees the same current plan, so you stop rebuilding a status deck every time someone asks "where are we?" Excel/PDF export is available too.
Why it fits dev teams
- Keeps your context: updates happen from the editor or chat
- Resilient to slips: dependency-aware auto-reschedule removes the manual fix-up on every change
- Trustworthy numbers: critical path and other math are settled on the server
- Free to start: free for 3 members, with AI generation and MCP included
For a full tool comparison, see the AI Gantt chart tools comparison.
Takeaway
Generate with AI, operate from your editor or chat, auto-reschedule slips, share read-only — with that loop, a Gantt chart stops being a diagram you abandon and becomes a living plan that keeps up with your team's pace. Start by writing your team's next release in one line.
Related Articles
Project Management in Cursor: Run a Real Gantt Chart via MCP
You already live in Cursor to write code — you can run the plan there too. Cursor is an MCP-capable client, so adding Ganty's MCP server lets you create tasks, update progress, and reschedule a Gantt chart in plain language: "what's due this week?", "design slipped, push everything after it." Setup steps and real examples.
2026-06-01How to Use Claude Code for Project Management: 5 MCP Examples for Natural-Language Gantt Workflows
A complete guide to operating Gantt charts from Claude Code in natural language. Setup, plus five developer-focused MCP patterns: auto-task from PRs, sprint progress summaries, release checklists, post-review delay surfacing, and code-aware task generation.
2026-06-06How to Auto-Generate a Gantt Chart with AI (2026): Free, Step by Step
Type a one-line project description and let AI generate the tasks and schedule. This guide covers exactly how to auto-generate a Gantt chart with AI for free, prompt tips that improve accuracy, and how to keep it running instead of stopping at a one-shot chart. Ganty is free forever for up to 3 members, no credit card.