Introducing Board View — a Kanban That Knows Your Schedule
Ganty Team
Ganty now has a Board View. Alongside the timeline (Gantt chart), you can see the same tasks as a status board, and switch between the two anytime from the toolbar.
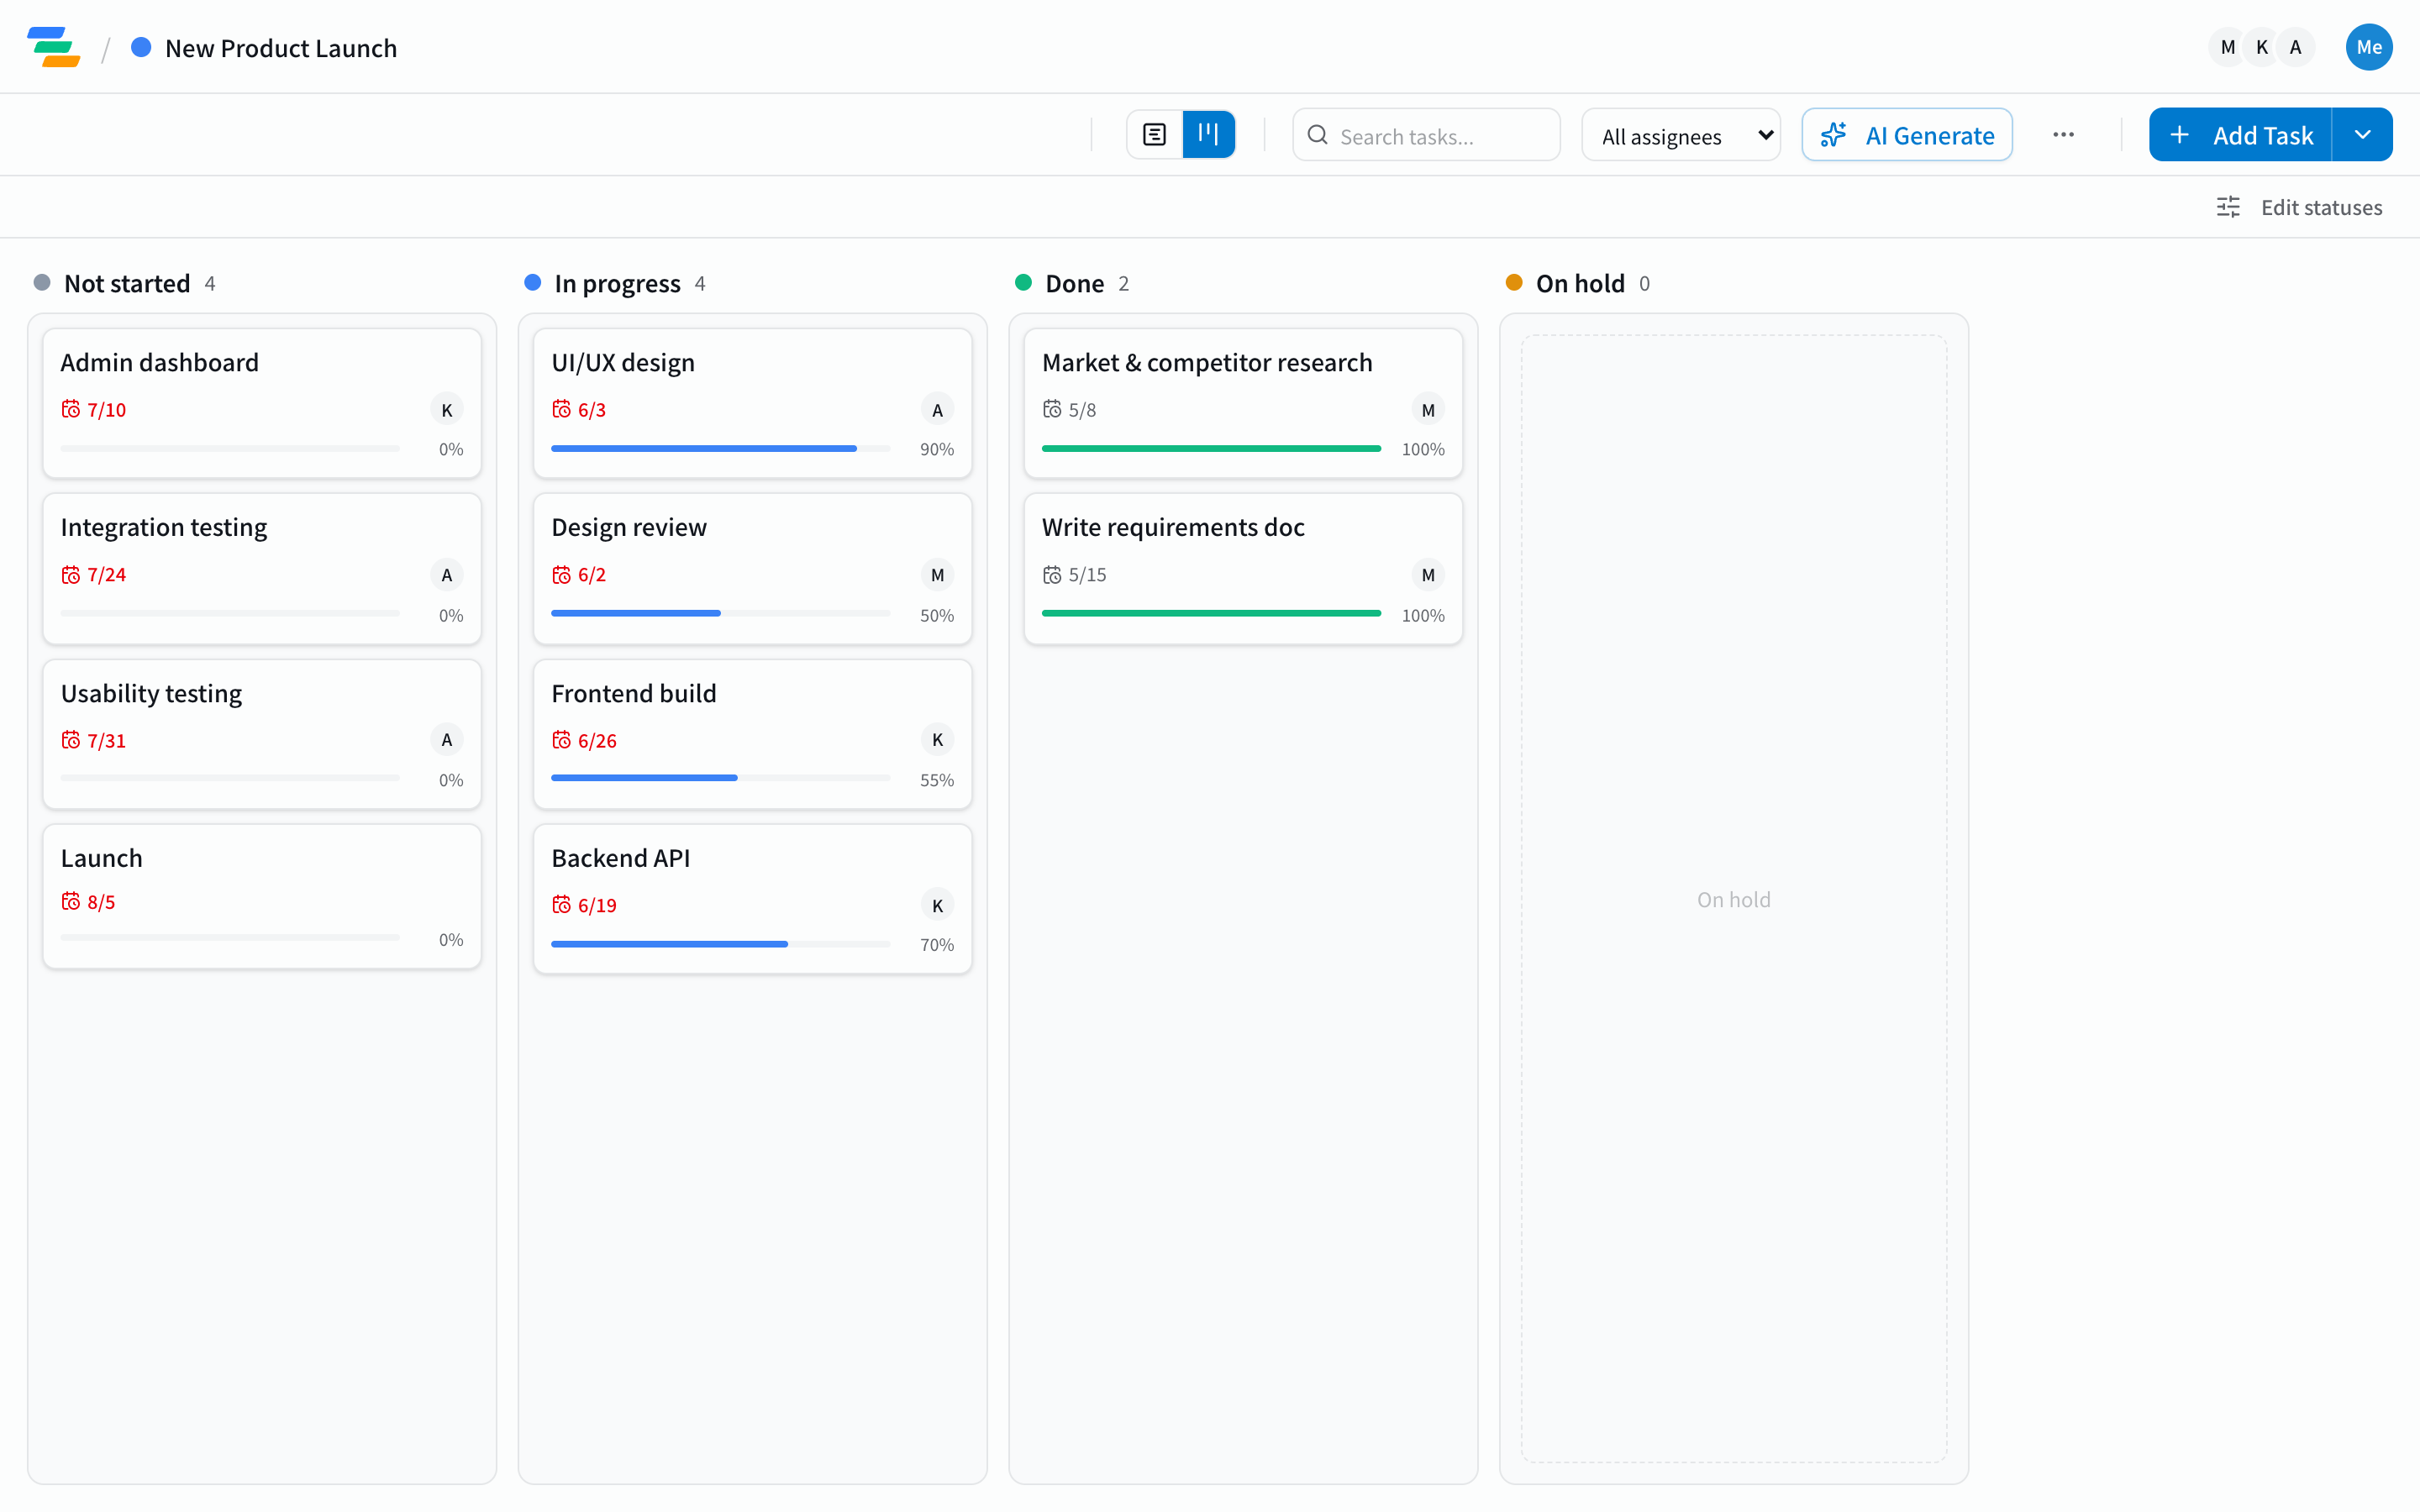
What you can do
- Four status columns: Not started / In progress / Done / On hold — your tasks as an at-a-glance board.
- Drag to change status: move a card between columns. Drop it in "Done" and progress snaps to 100%; "Not started" sets it back to 0%.
- Due dates and overdue at a glance: every card shows its due date, and unfinished past-due tasks turn red.
- Click for details: click a card to open its task panel.
Why add a board to a Gantt tool
A Gantt chart is for planning — you open it now and then to see the whole picture. A board is for doing — the daily surface where you move "what's next." Having both over the same tasks connects the plan to the daily work.
But Ganty's board differs from a typical Kanban in one way: it knows your schedule. Cards carry due dates, and late ones go red. A generic board has no "by when"; Ganty's board shares the Gantt's tasks, so it stays tied to your deadlines.
A design choice: the board never breaks your dates
Moving a card on the board does not change task dates. Only the status changes (plus progress for Done/Not started). The scheduling math — critical path, and dependency-aware bulk rescheduling — still runs exactly on the server, on the Gantt side. So you never get "the AI or a teammate moved the board and the schedule broke" (the same principle we cover in why AI-generated schedules drift).
How to use it
Open a project and pick "Board" from the view switch on the left of the toolbar; switch back to the timeline anytime. Haven't tried Ganty yet? The no-signup demo lets you play with the board, the Gantt, AI generation, and MCP — all free on every plan.
Takeaway
With Board View, Ganty lets you move between planning (Gantt) and doing (board) over the same tasks — the ease of a Kanban with a Gantt's sense of time. For choosing between them, see Gantt vs Kanban vs Scrum.
Related Articles
Why AI-Generated Schedules Drift — and How to Tell If Yours Will
LLMs are bad at date arithmetic. That is why 'AI-generated Gantt chart' tools look clean at first but quietly drift as you make changes. Here are the three reasons schedules drift — dependency chains, progress-aware remaining duration, and business days — and how to tell whether a tool will hold up when you let AI drive.
2026-07-24How a Software Team Plans a Release with an AI Gantt Chart
Follow a concrete scenario — a five-person team planning a ten-week release — to see how an AI Gantt chart actually gets used. Generate the plan from one line, update it daily from Claude or Cursor over MCP, auto-reschedule along dependencies when design slips, and share a read-only link with stakeholders.
2026-09-18The Best AI Gantt Chart Tools in 2026: Claude MCP, ChatGPT, and Specialized Platforms Compared
The 2026 buyer's guide to AI Gantt chart tools. Compare 9 platforms across Claude MCP, ChatGPT, Asana AI, Monday AI, and Microsoft Project Copilot — with team-type recommendations, setup cost, and the AI features that actually move the needle.